Ever tightening regulatory demands lead to greater sensitivity requirements from commonly utilized analytical techniques such as GC-MS. In addition, there is a desire to reduce the injected volume of samples in order to minimize matrix effects and the contamination of instrumentation. The powerful combination of the Xevo® TQ-S equipped with APGC ionization provides a robust and highly-sensitive analytical solution for the analysis of compounds at ultra-trace levels.
Atmospheric Pressure GC is an ionization technique similar in nature to Atmospheric Pressure Chemical Ionization (APCI).
The ionization is ‘soft’, i.e. fragmentation of compounds is very low, especially when compared to Electron Ionization (EI). This means sensitivity and selectivity is increased and MRM precursor selection in simplified.
At the core of the Xevo TQ-S are StepWave ion optics. StepWave is equipped with a larger sampling orifice, an enhanced pumping configuration and T-Wave™ enabled stacked-ring ion guides. This means the instrument can sample a greater volume of gas, increasing sensitivity while removing unwanted background species.
A combination of these technologies means that Xevo TQ-S APGC is a sensitive, easy to use, accessible analytical system.
History
Atmospheric Pressure Ionization was developed in the early 1970s using a 63Ni source or a corona discharge needle[1,2], but none of these systems were fully commercialized. More recently, an atmospheric pressure ionization source coupled to a gas chromatograph was developed by McEwen[3]. This source design was adopted and modified and commercialized by Waters® (in 2008). This source was designed to fit Waters Universal Sources.
Theory
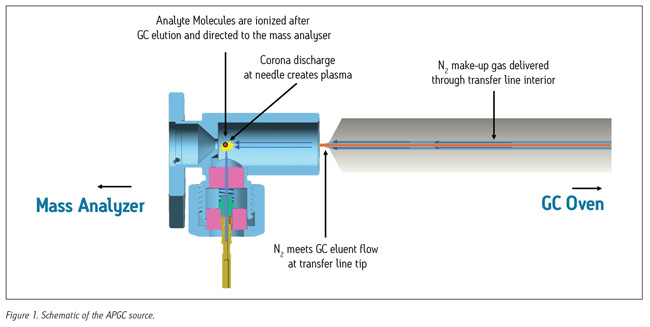 APGC is an atmospheric pressure ionization technique. The source is based on a Waters ESCi (Electrospray/APCI) source; the sample cone used in ESCi® is replaced with a specific ion chamber for APGC. See Figure 1 for a schematic. A corona pin is present inside the ion chamber, this corona pin creates a nitrogen plasma and this plasma reacts with either the analyze molecules or any modifier present in the ionization region. For reaction see Figure 2.
Mechanisims of Ionization
There are two primary mechanisms of ionization that APGC can undergo:
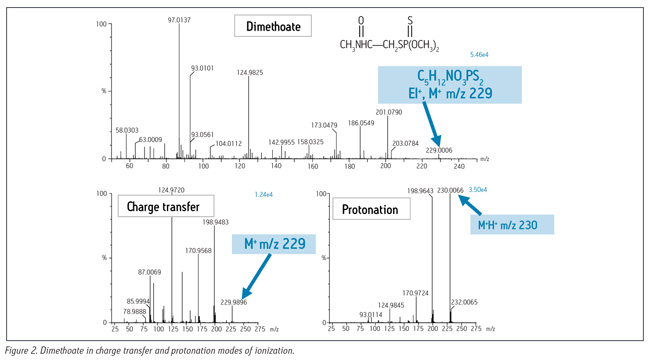
1. Charge transfer initiated by corona discharge ionization of the nitrogen in the source to generate radical cations of nitrogen which can then undergo charge transfer with analyze molecules to generate radical cations of the analyze molecules. This form of ionization is favored by non-polar compounds.
2. Protonation where the proton source can be water, MeOH, etc… This form of ionization is favored by relatively polar compounds.
It is possible to select between proton transfer and charge transfer in APGC by altering source conditions or the system can be used in a mixed mode (whereby charge transfer and protonation can occur).
Reaction Mechanism of Nitrogen Plasma in the Ionization Region.
N2+ and N4+ are formed in the plasma then:
N2++M > M+ + N2
N4++M > M+ + 2N2
In addition with trace amounts of water:
H3O+ then
H3O+ + M > MH+ + H20
With a higher concentration of water:
H+(H2O)n then
H+(H2O)n + M > MH+ + nH2O
The water is effectively acting as a modifier.
Method optimization
There are several parameters that need to be optimised to ensure sensitivity and stability for APGC. It is recommended that a short GC run containing relevant components is used to optimize these flows. Once these flows are optimised it is not expected for them to be altered in normal operation.
Make-up flow
Make-up flow is a nitrogen flow supplied by the GC. The flow is around the outside of the GC column within the heated transfer line (HTL), see figure 1. It is recommended this flow is set at a constant pressure (80 – 90 psi).
Auxiliary flow
Auxiliary is a nitrogen flow supplied from the MS into the source region. It is recommended that the flow is set to between 50 – 100 L/h. If peek tubing is present in the source (refer to installation manual) the flow should be set between 200 – 300 L/h.
Cone gas
Cone gas is a nitrogen flow supplied by the MS around the outside of the sample cone. This (along with make-up gas) is critical to the stability of the plasma in the ionization region since it is the balance between these two gas flows that is critical for optimum operation. The default minimum gas flow is set to 150 L/h to ensure gas balance in the source. It is recommended to set the flow between 170 – 225 L/h. Higher gas flows will drive the ionization towards charge transfer.
Corona current
The corona current should initially be optimised in voltage mode (see manual for details). The GC oven should be set to > 250 °C and the ions m/z 207/281 should be monitored. In voltage mode, starting at 1.5 kV the voltage should be raised in steps of 0.1 kV until the plasma is initiated (~2.0 kV) and the value which gives the best stability and sensitivity determined. Once this voltage is known, the current should be set to give this voltage read back. Once this has been set it will not need changing in normal operation. A high voltage read back (with no change in supplied current) can indicate a contaminated or blunt pin.
MRM transitions
If the ionization of the compounds is not known, then full scan MS should be run to determine this. If, for example, the compounds give similar spectra to NIST library spectra (e.g. dioxins or PCBs) then transitions for EI can be used. If compounds show M+H+ then an ESi transition may be used.
The collision energy should be optimized to give best signalto-noise. Dwell times should be set to ensure that there are an appropriate number of points per peak. MassLynx® autodwell function should be used for this purpose.
GC method
GC methods can be developed exactly the same way as traditional GC/MS methods. It must be noted that since APGC is not a vacuum source, the column flow is not limited to 1 mL/min. Higher flows to improved chromatography and separation may be used.
Example data
A mix of pesticide residues were analyzes using the Xevo TQ-S with APGC over a five day period in solvent and various food matrices (strawberry, pear, tomato, spinach). Some examples of the data obtained is shown in figures 4 - 7 below.
Sensitivity
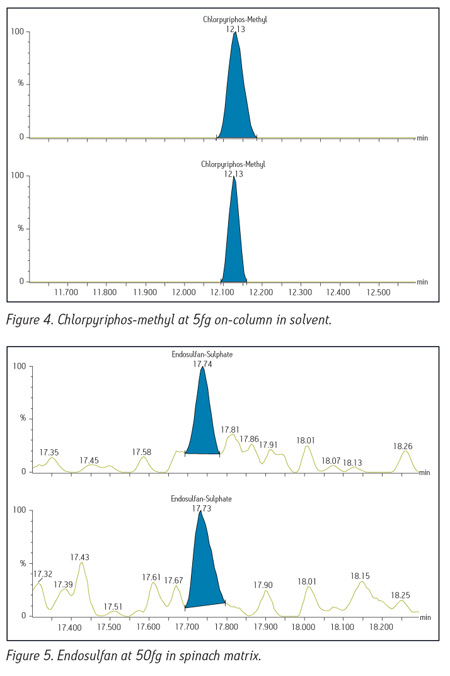 Figures 4 and 5 show examples of the sensitivity obtained from the analysis. Figure 4 shows chlorpyriphos-methyl at 5fg on-column and figure 5 shows endosulfan-alpha at 50fg on-column in spinach matrix.
Linearity
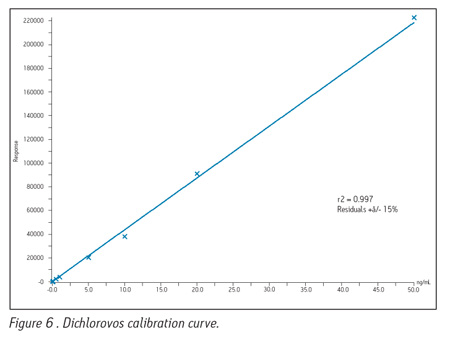 Figure 6 and figure 7 show calibration curves for dichlorvos and azinphos-methyl over a concentration range from 5fg – 50pg (on- column). Dichlorovos gives a correlation coefficient of R2=0.997 with residuals ±15%, azinphos-methyl gives a correlation coefficient of R2=0.997 with residuals ±20%.

Matrix samples
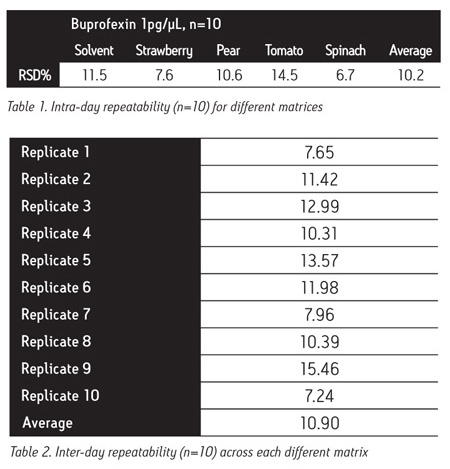
To test repeatability and robustness the residue analysis was carried out over five days. Each day ten replicates of matrix samples were analyzed. Table 1 shows the %RSD for the ten injections each day and the intra-day repeatability over the five days. Table 2 shows the inter-day repeatability across each of the different matricies.
Summary
The Waters TQ-S with APGC is a system that allows a LC & GC on the same analytical platform with a quick and easy changeover between the two.
The theory and optimization of APGC for ultra-trace quantification is described and the analysis of pesticides in solvent standards and matrix is shown as an example.
Example data shows excellent sensitivity, linearity and robustness of pesticides in matrix analyzed over a period of five days.
A combination of Atmospheric Pressure Gas Chromatography and the Waters Xevo TQ-S is a powerful, flexible, easy to use analytical system.
References
1. (1) Horning, E. C.; Horning, M. G.; Carroll, D. I.; Dzidic, I.; Stillwell, R. N. Anal. Chem. 1973, 45, 936-943.
2. (2) Horning, E. C.; Carroll, D. I.; Dzidic, I. Clin. Chem. 1977, 23, 13-21.
3. (3) McEwen, C. N.; McKay, R. G. J. Am. Soc. Mass Spectrom. 2005, 16, 1730-1738.