Melamine is a nitrogen-rich industrial chemical with many different uses; one of the most common is in the manufacturing of melamine resin, a very durable polymer. In spring of 2007, melamine became well known in North America after its presence in wheat gluten was linked with renal failure in dogs and cats.[1] Further studies led scientists to believe that a combination of melamine and its related homologues—ammeline, ammelide and cyanuric acid—caused the illness of these pets.[2] Investigation into ingredient material sources of pet food resulted in the determination that melamine was intentionally added to wheat gluten to increase the apparent protein content. The industry-standard test for protein content measures only nitrogen and correlates the result to protein; melamine is a very inexpensive nitrogen source that will dramatically increase apparent protein concentration under this type of test method.
The concern over melamine adulteration spread to includea number of different types of dry protein materials in both animal and human food sources. High visibility and the potential public health threat prompted the U.S. Food and Drug Administration (FDA) to rapidly issue a standard test method for the analysis of melamine in protein materials. This method, entitled “GC-MS Screen for the Presence of Melamine, Ammeline, Ammelide, and Cyanuric Acid”[3] is used in conjunction with nitrogen tests to verify that a material is protein-rich, rather than rich in non-protein nitrogen. The presence of any amount of melamine or its related analogues renders the product adulterated and illegal to sell. The FDA methodology is used for qualitative confirmation and semi-quantitative estimation only.
This paper presents a robust, efficient and definitive analysis of melamine and related analogues. The sample preparation, including extraction and derivatization, are discussed in addition to the optimized gas chromatography/mass spectrometry (GC/MS) method.
Experimental
The experimental portion of this paper is broken into three parts: extraction, derivatization and GC/MS analysis; this extraction, derivatization and GC/MS analysis closely follow the method published by FDA.
Extracting melamine from dry protein materials is relatively simple; a 0.5-g sample is sonicated in 20 mL of 10:40:50 (by volume) solution of diethylamine (DEA), water, acetonitrile. The sonication period is 30 minutes to allow for complete extraction. Following sonication, the sample is centrifuged for 10 minutes at 3,500 rpm to settle fine particulates from the sample matrix. The supernatant fluid is filtered through a 0.45-μm polytetrafluoroethylene (PTFE) filter; a PTFE filter is preferred because many compounds found in food-type matrices adhere to other filter materials. Once filtered, 200 μL of the solution is evaporated to dryness at 70 °C with a flow of clean, dry nitrogen gas. Once dry, the sample is ready for derivatization.
The dry sample is reconstituted in an autosampler vial with 200 μL pyridine and 100 μL of a 0.5-μg/mL internal standard (ISTD) solution. Melamine and related compounds are converted to trimethylsilyl (TMS) derivatives with the reagent Sylon-BFT (Supelco) consisting of bis(trimethylsilyl)trifluoroacetamide with 1% trimethylchlorosilane; 200 μL of this solution is added and the sample is incubated at 70 °C for 45 minutes. One important note on derivatization is to consider your matrix and how it will react with the reagent. When derivatizing an amino acid-rich matrix, less sample or more reagent may be necessary to compensate for the consumption of the Sylon-BFT by the amino-acids; some experimentation may be needed. The ISTD, 2,6-diamino-4-chloropyrimidine (DACP), monitors the derivatization process; poor ISTD recovery is indicative of incomplete derivatization, likely resulting from residual water or an active matrix.
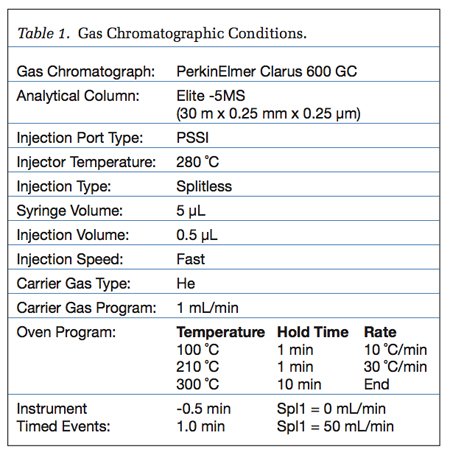 The GC/MS system used in this paper was the PerkinElmer® Clarus® 600 GC/MS and the instrument parameters are summarized in Tables 1 and 2. The GC utilized a programmable split/splitless injector, isothermal at 280 °C. A 2-mm I.D. inlet liner was used; the 0.5-μL injection volume matched the solvent vapor-expansion volume with the inner volume of the inlet liner, an injection of larger volume will result in vapor expansion outside the liner; when the solvent expansion exceeds the liner volume, chromatographic peak shape often degrades.
The instrumental conditions presented here are optimized for the analysis of melamine in rice protein; in this case, it was necessary to extend the GC oven program to resolve ammeline and melamine from matrix peaks. The variety and complexity of sample matrices may require modifying the GC method to achieve resolution between analytes and matrix interference; modifications to achieve better resolution must be considered on a per-matrix basis. The best technique to match resolution to sample matrix is to compare the analysis of a blank spike with the analysis of the sample matrix. If the peaks associated with sample matrix elute at times different than the retention time of the analytes, the method does not need modification. However, if matrix peaks co-elute with analytes, then it is necessary to modify the temperature ramp of the GC oven to improve resolution.
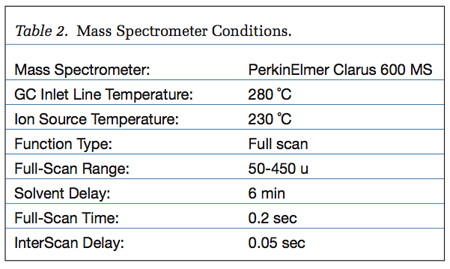 In this method, the MS functions scanned from 50–450 µ, collecting full spectral data. The spectral data serves to confirm the identity of all analytes. The transfer-line and ion-source temperatures were set to 280 °C and 230 °C respectively. The background-subtracted experimental spectra collected during the analysis of a high-level standard serve as reference spectra for compound identification.
 Results
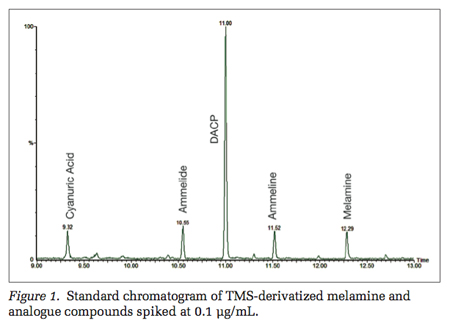
As previously mentioned, the detection of melamine or analogues indicates adulteration, making the product illegal to sell as a food or feed additive. Because of the potential financial impact to the food industry and the health risk to humans and animals, many data quality checks (QC) are necessary to confirm results. In addition to high- and low-level standards, the QC needed for this method includes a solvent blank, analysis of pyridine solvent and derivatization reagent; a method blank, unspiked solvent carried through the extraction process; and a matrix-spike sample at both the low and high levels. Although this is a pass/fail screening method, the low (0.1 μg/mL) and high (1.0 μg/mL) calibration standards are analyzed before and after the sample batch—this allows a semi-quantitative result to be determined. Figure 1 shows a chromatogram of the low standard. As you can see, even at the low level, the analyte response is quite intense—the GC/MS system provides ample sensitivity.
The sample matrix requiring protein-adulteration analysis includes a wide array of interferences; as was discussed in the experimental description, it may be necessary to modify the GC oven ramp to allow for melamine and related compounds to be resolved from matrix peaks. An additional technique to reduce sample matrix affects is to extract smaller sample amounts. Extracting a smaller sample will decrease the effect high-boiling matrix compounds have on the GC/MS system. As sample amount is reduced, it is necessary to increase the sensitivity of the GC/MS to detect low-level contamination. Single ion and full ion (SIFI) scanning is a MS data-collection mode that combines simultaneous single-ion and full-scan data collection; this allows for maximum sensitivity, while maintaining full-spectra data collection. In this case, the sensitivity achieved with full-scan data collection was sufficient; however, in an instance where greater sensitivity is needed, SIFI provides a solution.
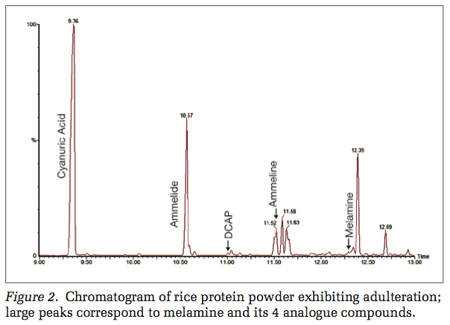 In addition to the standards and QC-type samples, a number of protein materials were analyzed. A rice-protein sample, in which adulteration compounds are present at high levels, is pictured in Figure 2. The high level of contamination in this sample demonstrates the effective use of QC procedures discussed earlier. The DACP ISTD verifies that the derivatization reaction reached completion; the area of DACP in the sample is compared with the DACP area of the standard. In this case, the average peak area of DACP in the standards was 643,161 and the DACP peak area in the sample is 646,585, verifying complete derivatization.
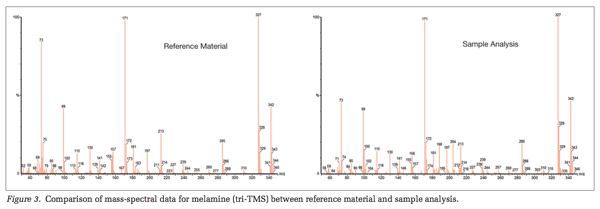 The level of sample contamination is such that the GC column phase is overloaded, as the overloading is demonstrated by the distorted peak shape and shifted retention times of cyanuric acid and ammelide in Figure 2. Additionally, this sample needs re-extraction and analysis with a smaller sample amount because the analyte response is above the range of the high and low standard. Melamine was detected at a low level compared to analogue and matrix peaks; the optimized GC method presented here completely resolved it from surrounding peaks, allowing for easy identification. Mass spectral comparison between standard spectra and experimental spectra of melamine confirm the peak identity. Figure 3 demonstrates the comparison of spectral data between a melamine (tri-TMS) standard and sample analysis; the spectral and retention-time matches confirm the compound identification.
Conclusion
Large volumes of protein-based raw materials are used in food and feed production worldwide. Recent adulteration with melamine and related analogues has created the need for more detailed testing of protein-based food and feed ingredients. This analysis is important because it detects common adulterants and works in conjunction with total nitrogen testing to verify the quantity and authenticity of protein in a food product.
This paper has presented sample-preparation and instrumental techniques for the analysis of melamine and related compounds based on the newly released FDA method. The sample preparation includes solvent extraction and silyation; an ISTD compound verifies the complete derivatization of the sample and serves as an indicator of matrix-derivatization reagent- interaction problems. The GC/MS analysis is a semi-quantitative screening method; low and high-level standards bracket the sample analysis. In addition to standard analysis, multiple blanks and matrix-spike samples verify the quality of the test. The Clarus GC/MS system detected adulteration at the low-level spike in full-scan mode, demonstrating exceptional sensitivity for routine screening of complex matrices.
James Neal-Kababick is with Flora Research Laboratories and William Goodman is with PerkinElmer, Inc. For more information, please visit www.perkinelmer.com.
References
1. www.fda.gov/AnimalVeterinary/SafetyHealth/RecallsWithdrawals/ucm129932.htm.
2. www.utsc.utoronto.ca/~traceslab/MelamineInFoodsGCMS.pdf.
3. www.fda.gov/AboutFDA/CentersOffices/OfficeofFoods/CVM/WhatWeDo/ucm134742.htm.