The global focus on food safety has intensified in recent years, resulting in major changes in the number of pesticides being regulated and monitored. These new regulations have driven the need for a wide range of instrumentation and analytical methods that possess the sensitivity, flexibility and reproducibility to meet the demand of testing labs all over the world.
There are currently more than 900 known pesticides used worldwide, both legally and illegally, on food products and in the treatment of soil and crops. Most of these pesticides have an established maximum residue level (MRL) for both food and water to protect the consumer. The U.S. Food and Drug Administration, the U.S. Environmental Protection Agency and the Food Safety and Inspection Service of the U.S. Department of Agriculture share in the responsibility for ensuring that pesticide residues in foods do not exceed the MRL. However, monitoring hundreds of pesticides in the food supply is challenging, since multiple analyses are typically required to detect and quantify all of the relevant compounds using chromatography or mass spectrometry.
In the following analysis, the Agilent 6410 Triple Quadrupole liquid chromatography/mass spectrometry (LC/MS) system[1] was used to screen for and confirm the presence of 301 pesticides in a single assay. The pesticides included in the analysis were chosen because of their frequent use on food commodities. The analysis employed a combination of 1.8-µm LC columns (for maximum peak capacity) and eight time segments with 100 transitions per segment, enabling the inclusion of both a quantifying and a qualifier ion, and, thus, satisfying regulatory specifications for unequivocal identification by MS. Presently, the time segments can be eliminated using dynamic multiple reaction monitoring (MRM) that allows many more compounds to be monitored with the same chromatographic conditions.
This study is one of the first of its kind to use Agilent 6410 Triple Quadrupole (now replaced by the 6420) for the analysis of pesticides in food and for hundreds of pesticides in a single analysis.
Experimental Sample Preparation
Pesticide analytical standards were purchased from Chem Services, Inc. (Philadelphia, PA) and Sigma Aldrich (Louisville, KY). Individual pesticide stock solutions (approximately 1,000 μg/mL) were prepared in pure acetonitrile or methanol, depending on the solubility of each individual compound, and stored at -18 °C. From these starting solutions, working standard solutions were prepared by dilution with acetonitrile and water.
Vegetable samples were obtained from the local markets. “Blank” vegetable extracts were used to prepare the matrix-matched standards for validation purposes. In this way, two types of vegetables (green peppers and tomatoes) were extracted using the QuEChERS method.[2] The vegetable extracts were spiked with the mix of standards at different concentrations (ranging from 0.1 to 100 ng/mL or ppb) and subsequently analyzed by LC/MS/MS.
Optimization of LC/MS/MS Conditions
The study consisted of two parts. The first part entailed optimizing the fragmentor voltage for each of the 301 compounds in order to produce the greatest signal for the precursor ion. Typically, the protonated molecule was used for the precursor ion. Each compound was analyzed separately using an automated procedure to check the fragmentor at each voltage. The data were then selected for optimal fragmentor signal and each compound was injected in a programmed run at a concentration of 10 μg/mL to determine collision energies for both the quantifying and qualifying ions. Various collision energies (5, 10, 15, 20, 25 and 30 V) were applied to the compounds under study. The energies were then optimized for each of the ions and the voltages that gave the best sensitivity were selected.
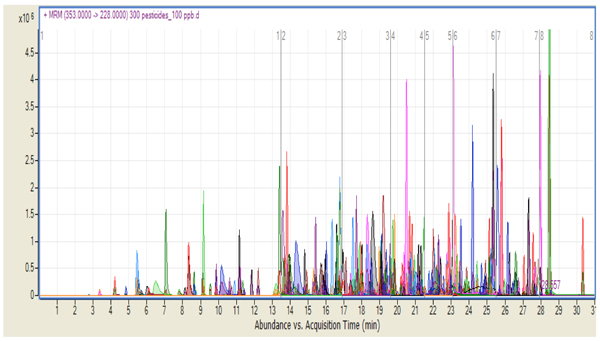 The MRM transitions used a dwell time of 10 msec. Eight different time segments were recorded in the chromatographic run, with each segment containing approximately 50 pesticides. It was necessary to overlap pesticides at each boundary of the time segment in order to monitor compounds that may elute at the exact moment of the time segment boundary. Note that this is no longer necessary if using dynamic MRM. Figure 1 shows the chromatogram corresponding to 100 ppb standard on the column for all 301 compounds studied. Extracted ion chromatograms are overlaid for each one of the target analytes according to their respective protonated molecule and product-ion MRM transitions. (Figure 1: Product ion chromatogram for 301 pesticides with a concentration of 100 ppb standard showing the eight time segments.)
 Application to Vegetable Matrices
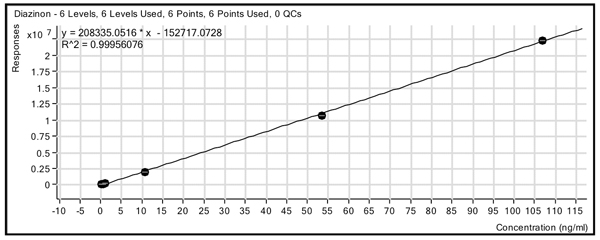
To confirm the suitability of the method for analysis of real samples, matrix-matched standards were analyzed in two different food commodity matrices (green pepper and tomato) and compared with solvent at six concentrations (0.1, 0.5, 1.0, 10.0, 50.0 and 100 ng/mL or ppb). Figure 2 shows an example standard curve for diazinon in the green pepper matrix. The compounds gave linear results with excellent sensitivity over more than two orders of magnitude, with r2 values of 0.99 or greater for the majority of compounds and limits of detection (LODs) of 1 to 10 pg for 150 of the compounds and from 10 to 100 pg for 140 compounds. There were 11 compounds that poorly ionized or gave poor chromatography and did not respond with sufficient signal to reach the 0.010 mg/kg level. (Figure 2: Calibration curve for diazinon in pepper using a six-point curve from 0.1-100 ng/mL (ppb) with a linear fit and no origin treatment.)
 Figure 3 shows the ion ratios qualifying for the synthetic organophosphate diazinon in an extract of green pepper spiked with the pesticide mix at 0.010μg/g (100 pg on the column). The mass-to-charge ratio (m/z) 169 ion was used for quantification, and the m/z 153 ion was used as the qualifier ion, with a window set at ± 20% for the ion ratios. As shown in Figure 3 in the two ion profiles, diazinon was easily identified in this complex matrix due to the selectivity of the MRM transitions and instrument sensitivity. In general, the LODs for the 301-pesticide mix met the requirements regarding the MRL imposed by existing European regulations. Furthermore, the use of 1.8-µm packing resulted in sharp chromatographic peaks of 5 to 10 sec in width. Thus, it was important to use fast dwell times of 10 msec in order to keep the quantitation results. Finally, the analysis for repeatability of the instrument for the quantifying ion gave a relative standard deviation (RSD) for five repeats of 6% (median RSD) and a mean RSD of 6.7%. These values were determined at the 0.1 mg/kg level (100 ppb) × 105 × 106 acquisition time (min).
Conclusions
This study demonstrated that the Agilent 6420 Triple Quadrupole is a robust and sensitive instrument that yields reproducible results in the analysis of pesticides in food, such as vegetable extracts, using high-throughput methods that meet regulatory standards. The LOD for the instrument was in the 1.0 to 10 pg range for 50 percent of the compounds and 100 pg for 90 percent of the compounds studied. These LODs included both the quantifying and qualifying ions, which is quite important for identification. These LODs are sensitive given that the segments contained 100 transitions, which are sufficient to analyze approximately 30 to 40 compounds per segment (with an overlap of 5 to 10 compounds per segment, a minimum if good reproducibility of the method is to be obtained).
The Agilent 6420 Triple Quadrupole was capable of reaching a LOD of 0.010 mg/kg (ppm) for at least 90 percent of the pesticides monitored in this study using the two-product ion criteria for confirmation, and a 10-μL injection, which is a typical injection volume. This MRL is the baby food limit, the limit for banned pesticides, and the typical requirement of a newly purchased LC/MS/MS system by environmental and food scientists who work on real food matrices. These results are important, given the increasing pressure on regulators and food quality laboratories to monitor the food supply for a large number of pesticides.
Learn more at www.chem.agilent.com.
References
1. www.chem.agilent.com/Library/applications/5989-5469.pdf
2. M. Anastassiades, S.J. Lehotay, D. Stajnbaher and F.J. Schenck. 2003. J. AOAC Int, 86:412–431
Multiresidue Analysis of 301 Pesticides in Food Samples by LC/Triple Quadrupole Mass Spectrometry