Peter Drucker once said, “What gets measured gets managed.” But it’s not always that easy, is it?
Every food processor is focused on producing high-quality products that are safe for the public to consume. It is no secret to them that a well-designed and executed sanitation program is instrumental in achieving this goal. Adenosine triphosphate (ATP) detection has become the industry standard for “measuring” or monitoring these sanitation programs. As ATP is present in all living things and is easily detected, it serves as an excellent indicator of the cleanliness of equipment and surfaces in a food processing environment. Results are available in just seconds, providing the instant information necessary for immediate decisions about either beginning production or initiating re-cleaning procedures. For many, this may be the only point in the process that ATP results are ever utilized. There is, however, a great deal of value remaining in these data.
What prevents quality assurance (QA) managers from leveraging these data to its fullest extent and truly managing their sanitation program? For many, it is the complicated nature of the software programs provided for this very purpose. Most data analysis programs included with ATP detection systems require busy QA managers to spend an extensive amount of time up front entering information into the software in precisely the right way. Even more time is required to determine which specific combination of reports is necessary to generate the information they are seeking. Typically, QA managers are forced to either choose from a long list of predefined reports that do not quite fit their needs or use the software to build their own custom reports. In some instances, they have opted to manually record ATP results in a separate spreadsheet and conduct their own simplified analysis of the data. Still, others have decided that the benefit is simply not worth the effort required.
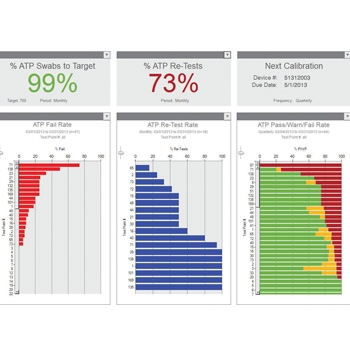
The recently introduced LIGHTNING MVP ICON™ ATP detection system from BioControl includes the industry’s first data analysis program with a dashboard display that automatically provides QA managers with the information they need to manage their sanitation program. The MVP ICON Dashboard software includes a full array of detailed trending reports that can be easily customized if necessary, but it is the dashboard display that truly sets it apart as a management tool. Updated with real-time data, the dashboard provides QA managers with a wealth of information regarding their ATP monitoring program and effectiveness of their sanitation program. Without running a single report, they can instantly see which specific test points have the highest fail rates and represent the greatest risk so they can immediately focus their cleaning efforts in those areas. Managers can easily verify that all failed test points were appropriately re-cleaned and re-tested. They can even track their swab usage for any set period of time to verify the proper amount of testing is being conducted. Too many tests and they know there was likely a significant sanitation problem that caused their QA staff to perform extra testing. Too few tests and they know to check for an unexpected change to the production schedule or meet with their QA staff to determine why the required testing was not performed.
The dashboard display is simple and easy to understand. All information is presented in a universally recognized color-coded system; red clearly identifies areas requiring immediate attention, yellow indicates an emerging problem that should be closely monitored and green means everything is OK. Whether it is the calibration status of the MVP ICON instrument or the distribution of pass, warn and fail results for a specific test point, the intuitive color-coding enables users to know at a glance how well the sanitation program is working. The dashboard can be easily converted to a PDF file with the push of a button, and the valuable information can be conveniently shared via email with corporate management, QA staff at other locations or auditors.
There is definitely truth in Drucker’s often-cited quote. What gets measured does indeed get managed. But as is often the case, this simple statement does not tell the whole story. Collecting the data does not ensure that they will be used. A great deal of time and effort may be required to analyze the collected data to distill them into meaningful and actionable conclusions. With the ever-increasing responsibilities of today’s QA managers, it is difficult for them to accomplish this task. Thankfully, technology is advancing at an even-faster rate. The Dashboard software has leveraged these advancements to provide an automated data analysis solution for monitoring ATP detection and managing sanitation programs.
To learn more about the full capabilities of the MVP ICON system for measuring ATP, pH, temperature, conductivity and sanitizer concentrations and how the MVP ICON Dashboard software can help manage your sanitation program, contact BioControl Systems at 800.245.0113, email info@biocontrolsys.com or visit us on the web at www.biocontrolsys.com.
p>