For many years, a so-called “danger zone” has been used for alerting foodservice and other food industry personnel about temperatures that are potentially hazardous for holding foods. Pictorial representations of thermometers with a “danger zone” highlighted have been used during training sessions for food handlers, food establishment managers and public health personnel, and this “zone” is commonly illustrated in food-related health education literature, posters and cards.
Historically, the “danger zone” was not mentioned in the 1952 edition of Sanitary Food Service, the Public Health Service’s (PHS) guide for foodservice personnel training, but it was stated as 60C to 7.2C (140-45F) in a 1969 revision of this guide.[1-2] The term, defined as 60C to 4.4C (140-40F), did appear, however, in 1956 in a foodservice training guide used in California.[3] Longree used the term, referring to 60C (140F) and 7.2C (45F) based on criteria from the 1962 food code, in the first edition of her book, and she stated that previous descriptions were narrower.[4,5] She stated that the upper temperature provided a margin of safety but the lower temperature was acceptable for short-term storage only. The term also was used in the book Applied Sanitation, and it is still used in subsequent revisions of this book.[6,7] Some presentations of the “danger zone” have expanded the range from 4.4C to 65.6C (40-150F ).
Before proceeding with a critique of the “danger zone,” some definitions need to be understood to put this issue into perspective. Words that have a relationship to the word “danger” have come into common usage in the food safety field. These are “hazard,” “severity” and “risk,” which have been defined and redefined as the Hazard Analysis Critical Control Points (HACCP) concept evolved and was implemented in quality control and food protection activities. Hazard, severity and risk were defined by the International Commission on Microbiological Specifications for Foods and modified by Bryan.[8,9] Accordingly, a hazard is an unacceptable contamination of a biological, chemical or physical nature, and/or survival or multiplication of microorganisms of concern to safety, and/or unacceptable production or persistence in foods of toxins or other undesirable products of microbial metabolisms. Severity is the magnitude of a hazard or the degree of consequences that can result when a hazard exists. It varies with the dose and individuals. Risk is an estimate of the probability of occurrence of a hazard or the sequential occurrences of several hazards. The National Advisory Committee on Microbiological Criteria for Foods combined hazard and risk concepts and defined a hazard as a biological, chemical, or physical agent that is reasonably likely to cause illness or injury in the absence of its control.[10]
Danger is the chance of harm, or a thing that may cause harm, or the threat of harm. Therefore, it has a meaning that encompasses all three of the previously defined terms, with particular emphasis on the term “risk.” Something that is highly or very dangerous, therefore, is present as an immediate hazard; it can result in a high degree of severity and it has a high expectation of risk or likelihood of occurring. Something that is less dangerous relates to situations that have lesser degrees of hazard, severity or risk or combinations of any or all resulting in less of a potential or total impact. A zone is a region or area set off as distinct from surrounding or adjoining parts or a section of an area created for a particular purpose.
This reevaluation looks at the “danger zone” on the basis of growth and survival or destruction of pathogenic foodborne microorganisms. It considers a series of loosely-defined zones, which present varying degrees of “danger” influenced by time and temperature, rather than a single zone.
Are We Really in the Zone?
Some temperatures included within the commonly cited “danger zone” are not dangerous, and others not included within this “zone” are dangerous under some conditions. In reality, the so-called “danger zone” specifies the legal limits for holding foods hot and cold as prescribed in the PHS or U.S. Food and Drug Administration’s (FDA) recommended model foodservice ordinances and codes, food code and related regulations. The 1943 PHS recommended ordinance specified the holding of all readily perishable foods at 10C (50F) or below during refrigeration.[11] There was no requirement for hot-held foods. The 1962 code prescribed that potentially hazardous foods should be held at temperatures either at or above 60C (140F) or at or below 7.2C (45F).5 The 1976 document restated this and further stated that these foods should cool to 7.2C (45F) within four hours.[12] The FDA’s 1993 Food Code prescribed the same hot holding temperatures (60C/140F), but the cold holding requirement was lowered to 5C (41F).[13] Also, cooling was to be done by reducing the temperature to 21C (70F) within two hours and continue to lower it to the required cold-holding temperature within another four hours. These temperatures have been maintained in subsequent revisions of the Food Code.
Because of code revisions throughout the years, the “danger zone” has changed according to the required hot- and cold-holding temperature requirements. Which one is the true “danger zone?” Did the danger change during the intervals between 1943 and 1962 and again between 1976 and 1993? If so, why? Or, is the “danger zone,” in reality, none of these ranges? If that is the case, these may be a series of ranges that represent different degrees of hazards and risks.
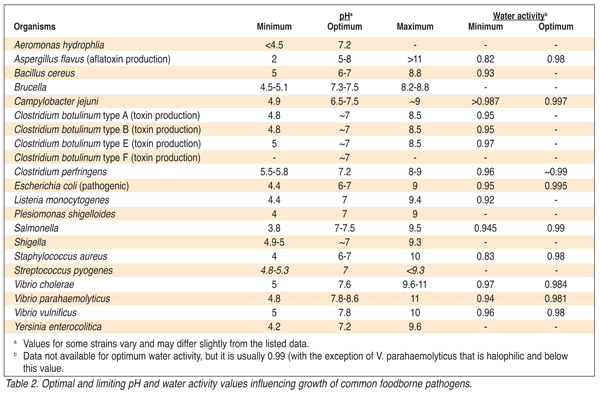
 Hazards and risks of holding foods within the traditional and any modified danger zones relate to growth of foodborne pathogenic bacteria and fungi. Maximal, optimal and minimal temperatures under otherwise optimal conditions for growth of common foodborne pathogens are listed in Table 1. Differences in the growth range and optimal temperature values for these bacteria vary, however, with substrate, environmental conditions and species and strains of microorganisms. Water activity and pH are important influences of bacterial growth. Minimal, optimal and maximal values of pH and minimal and optimal values for growth of common foodborne pathogens are given in Table 2. As pH decreases or increases from the optimal value for a specific pathogen, the bacterial lag phase before multiplication increases and the rate of growth afterwards decreases. From lags of an hour or so under optimal conditions, the time stretches to days near the minimal and maximal limits. As water activity values are decreased below the optimum, the lag phases increase and the growth rates decrease correspondingly. The maximum value for water activity lies somewhere between the optimal value and 1, the value of pure water, often above 0.98 to 0.999.
In addition, salt content, oxidation-reduction potential of the food and around it, the buffering capacity of the food, competition from other microorganisms, size of the initial populations of pathogens and competing organisms, and nutrients present in the substrate influence the rate of bacterial growth. All function simultaneously with temperature, pH and water activity. Many foods do not have intrinsic properties (e.g., pH, water activity and other characteristics) that are optimums for foodborne pathogenic bacteria. Therefore, in such foods, growth of these pathogens is delayed and not at the potentially fastest rate that can be obtained from specially compounded laboratory media that usually contain essential nutrients and is at optimal pH and optimal water activity and incubated at optimal temperatures.
There are several fallacies in the presentation of the so-called “danger zone” as traditionally used. Two of these relate to the upper part of the “zone.” Holding foods in the upper portion of the zone (e.g., upward from 50C [122F], with the possible exception of one or a few strains of Bacillus cereus (although the results were from laboratory media and conditions, not foods) and enterococci (if pathogenic) is not dangerous because all other foodborne pathogens cease multiplication between temperatures of 42C (108F) to 50C (122F). The second is as the temperature increases from approximately 51.7C (125F) (precise temperatures vary with substrate and microorganism), microbial death increases progressively.
Other fallacies relate to the mid portions of the zone. Optimal pathogenic foodborne bacterial growth occurs at temperatures between 46C (115F) to 30C (86F) (depending on the pathogen). As temperatures fall below the optimum toward the lower limit of the “danger zone,” which has varied over the years that this concept has been in existence, growth of pathogenic bacteria progressively slows and some pathogens even cease multiplication (Table 1). Additionally, some pathogens multiply, if given sufficient time, at temperatures below the lower limit (i.e., 7.2C [45F] from 1962-1993 and from 5C [41F] from 1993 to the present) of the “danger zone.”
Taking a Closer Look at Time-Temp
Research studies are presented to support remarks about the fallacies, and suggestions are given to revise the “danger zone” into a series of zones that reflect relative dangers (hazards and risks) and guide actions for prevention of foodborne disease outbreaks. The revised danger zones consider optimal, minimal, and maximal temperatures for growth of foodborne pathogens and the lethal effect of high temperatures.
The highest temperature for growth of common foodborne pathogens is that of Bacillus cereus. Two strains grew at 55C (131F) and one did not grow in supplemented media, but not in rice, which is a common vehicle in foodborne disease outbreaks.[14] The limiting upper-range temperature in foods (e.g., rice) has been 50C (122F).[15] Clostridium perfringens has grown at temperatures as high as 50C (122F), but with an initial decrease before an increase, which has been referred to as a “phoenix phenomenon.”[16] Some strains of Clostridium botulinum have been reported to grow at temperatures as high as 50C (122F).[17] Enterococci, which some but not all researchers consider as a foodborne pathogen, grows at 52.2C (126F) in ham salad, custard and chicken a la king.[18] Rapid declines in populations, however, occurred at 53.3C (128F).
Research data also show that temperatures within the upper portion of the “danger zone” are lethal for vegetative cells of foodborne pathogens if the duration of exposure is sufficiently long. For example, salmonellae in egg white solids (approximately 6% moisture) died after 7- to 10-day exposures at temperatures from 51.7C (125F) to 54.4C (130F).[19] These and other studies became the basis for warm-air pasteurization procedures for this product. A temperature of 51.7C (125F) gave a 107 log reduction of a mixture of six serovarieties of salmonellae in 10-lb. cuts of beef after 381 minutes exposure; 54.4C (130F) caused this decrease of these bacteria in 121 minutes; 57.2C (135F) was lethal to them in 38 minutes; and 60C (140F) killed them in 12 minutes.[20]
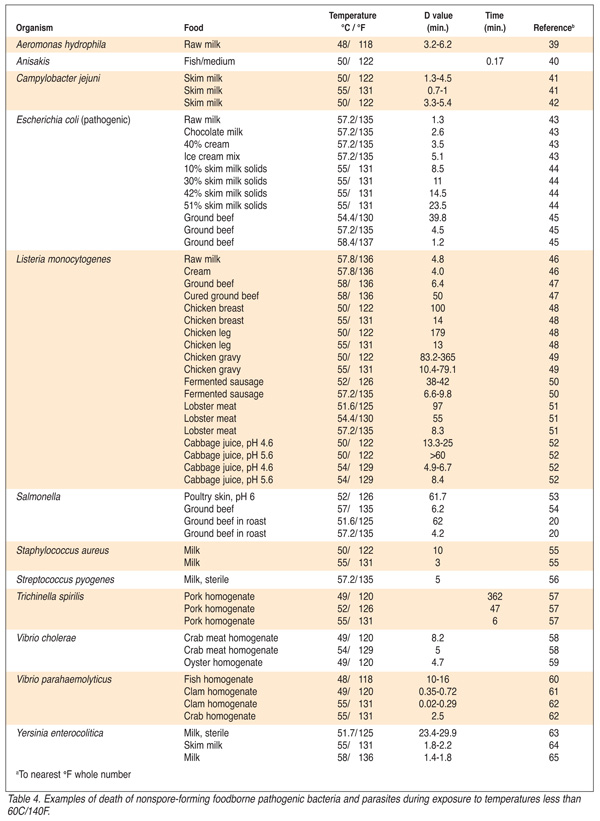
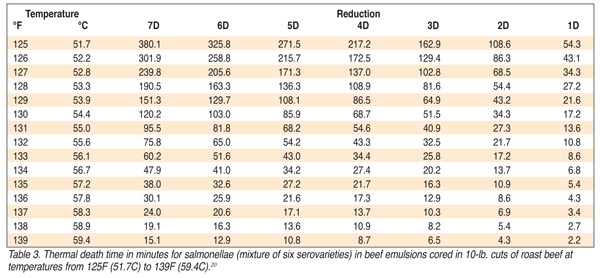 Specific times and temperatures for various decimal reductions (D values) are given in Table 3 for temperatures from 51.7C (125F) and 59.4C (139F). Populations of Escherichia coli decreased in meatballs, rice, peas, and macaroni and cheese while held at 50C (122F), and in decreasing time when these foods were held above this temperature.[21] Death of foodborne pathogenic bacteria can occur at temperatures between 51.7C (125F) and 60C (140F). D values for foodborne pathogenic bacteria and lethal time-temperature combinations for parasites in a variety of foods at temperatures below 140F are listed in Table 4. Without an awareness of these and similar data, it must be difficult to understand why certain time-temperature criteria for cooking, such as those for roast beef, are within the “danger zone.” We must wonder how a temperature can be approved for cooking that is within the “danger zone?” Quite a dichotomy!
Further, significant growth can occur in four hours or longer in foods held in the mid ranges of the “danger zone” (i.e., 30-46C [86-115F]), at and near temperatures optimum for growth of foodborne pathogens. This results in a high risk for food held in this way. As holding within this range continues, spoilage may result because bacteria other than the pathogens can outgrow the pathogens and produce metabolic products that are organoleptically offensive and unacceptable.
Holding foods at temperatures below the lower end of the “danger zone” can be hazardous if the duration of holding is several days or weeks, depending on the substrate, atmosphere and contaminants. Many pathogenic bacteria can grow at temperatures below 10C (50F); several can grow at temperatures below 7C (45F); and some can even grow below 5C (41F) (Table 1). For example, toxigenic strains of E. coli grew in broth and in broth with cream at 4C (39F).[22] Aeromonas hydrophila has been shown to grow at 4C, and even at a temperature as low as 1C.[23,24] Clostridium botulinum type E can grow in beef stew (and perhaps other foods) at a temperature as low as 3.3C (38F).[25] Yersinia enterocolitica grew at a temperature as low as 1C (34F) in raw beef and pork despite the presence of a large population of competitive microbial flora.[26] Listeria monocytogenes has been reported to grow at 0C (32F) and below.[27,28] Because of plasmid transfer, the potential exists for the growth of other infectious and toxigenic strains of enteric bacteria at low temperatures.[29] Thus, several foodborne pathogens can multiply at temperatures below those previously prescribed as the lower limit of the “danger zone.” Growth, however, at or near the minimal growth temperature for any species often takes several days or a few weeks to be detected. Other factors, such as substrate, pH, water activity, redox potential and competitive flora affect the outcome.
Developing a Realistic Model
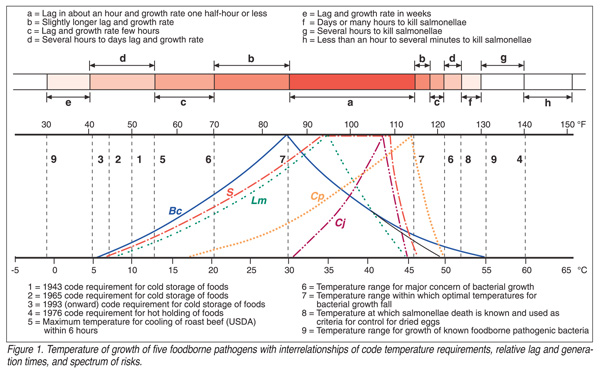 To put relative danger zones into a model that is representative of realistic risks, minimal, optimal and maximal growth temperature values on Celsius and Fahrenheit scales for foodborne pathogens (Table 1) must be considered. Values for five selected foodborne pathogens are shown in Figure 1. These are (a) B. cereus at the high end, and it also has a broad temperature growth range; (b) L. monocytogenes at the low end of the temperature growth range; (c) Salmonella represents an example of a common foodborne pathogen that has midrange values with a relatively wide optimal range; (d) Campylobacter jejuni that has quite restricted midrange values; and (e) C. perfringens that has high minimal and high maximal limits. Most other foodborne pathogenic bacteria fall within the overall range. The bacterial growth situation is shown with notations of limits of the former “danger zone” and other cardinal temperature values and approximate time necessary for growth to occur. This figure, however, is distorted, particularly in regions between the limiting and optimal growth values. Specific time-temperature values are not available in relationship to the entire growth range of these bacteria and, thus, the figure roughly estimates these values. The curves should be approximately bell shaped with relatively long bases, but the scale used did not accommodate this.
Data in Table 1 and Figure 1 are based on assumptions of ideal conditions for pH and water activity of the substrate, oxidation-reduction potential of the substrate and the air surrounding it, and of lack of significant competition from other bacteria. If any of these conditions or situations are less than optimum, the extreme values would constrict, the lag time increase and the growth rate decrease. This situation can be explained by the hurdle concept.[30] If any of the conditions are near the maximal or minimal values or if two or more conditions are less than optimum, even more constriction of the range and decreases of growth will occur. Just immediately beyond the minimal and maximal growth temperatures the bacterial lag is at infinity. The time for death is shortened progressively as temperatures increase above the maximal growth values.
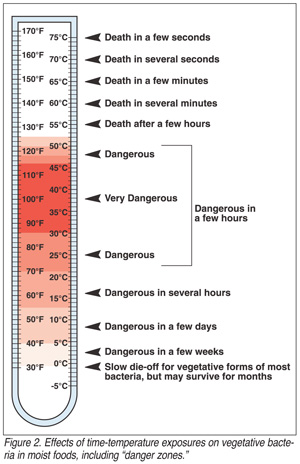 Figure 1 and the information presented in the above text were used as bases to construct a one-dimensional temperature scale from –5C to 75C (Figure 2) or from 23F to 167F that contains temperature values that affect growth and survival or destruction of foodborne pathogens. Shading is used to show degrees of hazard when foods are held within these ranges, which provides a second dimension. (The comparative values and shading on the scales vary slightly between the two figures due to dividing them to fit temperature values divisible by one.) Notations at the right of the pictorial thermometer scales are given to describe the shading and time of either likely growth or death of vegetative cells of foodborne pathogens within certain time frames. This figure shares features with some of those previously used (e.g. 7, 31-35 ) in that it shows rapid and slower bacterial growth within certain temperature ranges, but the former illustrations contain some of the fallacies described above. They stated bacterial growth, not growth of foodborne pathogenic bacteria. In this regard, they were inaccurate in that some thermophilic bacteria can grow at temperatures near 90C (194F). Some species found in soil, in hot springs and the intestinal contents of animals have maximum temperatures as high as 60-90C (140-194F) or higher.[36] Some psychrophilic bacteria can grow at a temperature near -10C (14F). Bacillus psychrophilus, for example, has a generation time of 6.5 hours at -5 to -7C (19 to 23F), and Debaryomyces hansenii can grow at a temperature as low as -12.5C (9F). [37,38]
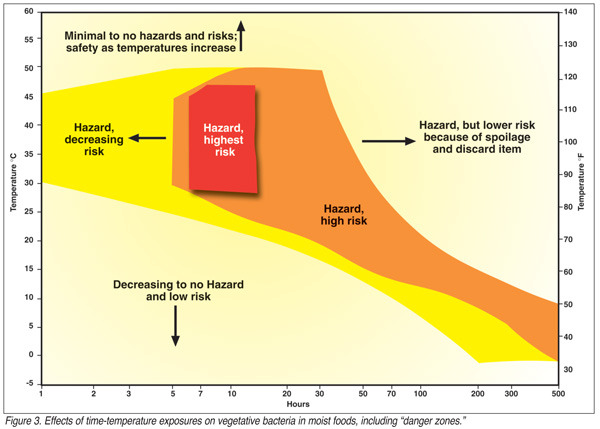 Figure 3 depicts a two-dimensional (time-temperature) illustration of the revised danger zone. Shading emphasizes variable risks and implies a third dimension. A semi-log scale is used for this depiction because to use a conventional, arithmetical time scale would cause the graph to be too long and low to be of any value in showing this phenomenon. This presentation is complex because of (a) the semi-log scale; (b) inaccuracies caused by generalizing data concerning specific pathogens to values for all foodborne pathogens; and (c) shaded portions give relative but not precise degrees of risk. The danger zone ought to be considered as a concept that has dimensions of time, temperature and degrees of risk. Time and temperature can be obtained from research data, but risks must be estimated. Furthermore, severity of the outcome might be worked into the presentation that would add a forth dimension, but severity varies with pathogen, dose and susceptibility. As a result, such presentations will require interpretations or explanations during use in training courses for foodservice personnel. Nevertheless, interpretations of relative degrees of risk must be considered in model danger zones. (Persons who have understanding of food microbiology, research data and knowledge of computer graphics are challenged to develop graphs with features of Figure 3. These presentations should be multidimensional and illustrate hazards [time, temperature, other intrinsic and extrinsic conditions that affect growth], risks, and perhaps, severity—a challenge for truth, perfection, and presentation graphics.)
Temperatures of potentially hazardous foods at the completion of cooking, during hot and cold holding, and during cooling need to be evaluated to determine hazards and risks during hazard analyses. They also need to be measured (a) as a part of monitoring critical control points, (b) during verification and validation of HACCP systems (c) during inspections to determine compliance to food code requirements or quality control standards, (d) and during investigations of foodborne disease outbreaks. Thermocouples that can be inserted at specific regions in these foods are particularly useful for this purpose. Geometric centers and (in some foods and situations) surfaces or other sites are measured at the anticipated time of termination of heating and continuing during tempering following heating. These foods being held hot need to be measured periodically (e.g., every two hours). These foods held at room or warm outdoor temperatures should be measured hourly and the duration adjusted by evaluation of the last reading. (After a measurement or two, there should be concern about the disposition of the food.) Cooling rates should be measured, particularly during the first two hours and then the next morning if it is not feasible to make intervening measurements. Cold-held foods, rather than the cold-storage unit’s ambient air, should be measured the day after they are put into a refrigerator and weekly after that if they are held that long. During cold holding, the duration of holding becomes a critical criterion to be controlled and measured. Interpretations of all temperature measurements in relationship to time must be made to assess the hazards and estimate risks.
A Final Caution
To retain credibility, public health authorities, food industry leaders and teachers need to be precise with words and presentation of microbiological data. If there is a clear and present danger, the concerns and situation should be emphasized. As stressed in the text, foodborne pathogenic bacteria multiply rapidly within the temperature range of 21C (70F) to 50C (122F). The range 30C (86F) to 46F (115F) encompasses the two extreme optimal temperatures (which results in a short lag period and rapid growth rate) for bacterial growth, and optimal growth temperatures for other bacteria fall within this range. Simplification is fine, but not to the extent that truth is altered. Beware of over-interpretation of code requirements as covering all foods under all processing operations, such as is done by calling temperatures higher than 55C (131F) dangerous and by calling temperatures below 5C (41F) safe if potentially hazardous foods are held for long durations at refrigerated temperatures.
The public and those in the food industry must be cautioned about the dangers of holding foods within temperature ranges that bacteria multiply, particularly within ranges that their lag phase is short and their growth rate rapid. Time considerations must be interrelated with temperatures for communicating this sort of information.
Frank L. Bryan, Ph.D., M.P.H., is president of Food Safety Consultation and Training, in Lithonia, GA, which specializes in conducting HACCP system evaluations in food processing plants, foodservice establishments and food markets, identifying CCPs, and recommending control criteria and monitoring and verification procedures. Internationally known for his work in food safety, Bryan served as a scientist director at the Centers for Disease Control and Prevention, Public Health Service from 1956-1985, where he focused on foodborne disease epidemiology, control and training, and was an active member of the International Commission on Microbiological Specifications for Foods from 1974-1996. He served as chairman of the Committee on Communicable Diseases Affecting Man, International Association of Food Protection (IAFP) from 1970-1999, and as consultant/advisor to the World Health Organization, Pan American Health Organization, Food and Agriculture Organization of the United Nations. Dr. Bryan can be reached at fscbryan@aol.com.
References
1. Milk and Food Branch, Division of Sanitation, Public Health Service. 1952. Instructor’s guide. Sanitary food service. Public Health Service, Washington D.C.
2. Consumer Protection and Environmental Health Service, Public Health Service. 1969. Sanitary food service. Instructor’s guide, 1969 revision. Public Health Service, Cincinnati.
3. California State Department of Public Health, and California State Department of Education. 1956. Food sanitation in commercial establishments. A guide for use of sanitarians in conducting food sanitation training classes. California State Department of Public Health, Berkeley, CA.
4. Longree, K. 1967. Quantity Food Sanitation. Interscience Publishers, New York.
5. Public Health Service. 1962. Food service sanitation manual. U.S. Government Printing Office, Washington D.C. (PHS Publ. No. 934.)
6. National Institute for the Foodservice Industry. 1978. Applied foodservice sanitation, 2nd ed. D.C. Heath and Company, Chicago.
7. Education Foundation. 1992. Applied Foodservice Sanitation, 4th ed. John Wiley and Sons in cooperation with the Educational Foundation of the National Restaurant Association, Chicago.
8. International Commission on Microbiological Specifications for Foods. 1988. Microorgan-isms in Foods 4. Application of the hazard analysis critical control point (HACCP) system to ensure microbiological safety and quality. Blackwell Scientific Publications, Ltd., Oxford.
9. Bryan, F. L., A. Bartleson, A., O. D. Cook, P. Fisher, J. Guzewich, B. Humm, R. C. Swanson, and E.C.D. Todd. 1991. Procedures to implement the hazard analysis critical control point (HACCP) system. International Association of Milk, Food and Environmental Sanitarians, Ames, Iowa.
10. National Advisory Committee on Microbiological Criteria for Foods. 1997. Hazard analysis and critical control point principles and application guidelines. (Source unlisted, but sponsored by USDA and FDA).
11. Public Health Service. 1943. Ordinance and code regulating eating and drinking establishments. 1943 Recommendation of the Public Health Service. United States Government Printing Office, Washington D.C. (PHS Publ. No. 37.)
12. Food and Drug Administration. Food service sanitation manual. 1976. U.S. Government Printing Office, Washington D.C. (DHEW Publ. No. [FDA] 78-2081.)
13. Food and Drug Administration. Food Code. 1993 recommendations of the United States Public Health Service Food and Drug Administration (and subsequent editions). Food and Drug Administration, Washington D.C./ U.S. Department of Commerce, Springfield, VA.
14. Johnson, K. M., C. L. Nelson, and F.F. Busta. 1983. Influence of temperature on germination and growth of spores of emetic and diarrheal strains of Bacillus cereus in a broth medium and in rice. J. Food Sci. 48:286-287.
15. Gilbert, R. J., M. F. Stringer, and T. C. Pearce. 1974. The survival and growth of Bacillus cereus in boiled and fried rice in relation to outbreaks of food poisoning. J. Hyg. 73:433-444.
16. Collee, J. G., J. A. Knowlden, and B. C. Hobbs. 1961. Studies on the growth, sporulation and carriage of Clostridium welchii with special reference to food poisoning strains. J. Appl. Bacteriol. 24:326-339.
17. International Commission on Microbiological Specifications on Foods. 1996. Microorganisms in Foods 5. Microbiological specifications of food pathogens. Blackie Academic & Professional, London.
18. Angelotti, R., K. H. Lewis, and M. J. Foter. 1963. Fecal streptococci in foods time-temperature effects on. I. Behavior in refrigerated and at warm holding temperatures. J. Milk Food Technol. 26:285-316.
19. Banwart, G. J. and J. C. Ayres. 1956. The effect of high temperature storage on the content of Salmonella and on the functional properties of dried egg white. Food Technol. 10:68-73.
20. Goodfellow, S. J., and W. L. Brown. 1978. Fate of Salmonella inoculated into beef for cooking. J. Food Prot. 41:598-605.
21. Makukutu, C. A., and R. K. Guthie. 1986. Survival of Escherichia coli in food at hot-holding temperatures. J. Food Prot. 49:496-499.
22. Olsvik, O., and G. Kapperud. 1982. Enterotoxin production in milk at 22 and 4oC by Escherichia coli and Yersinia enterocolitica. Appl. Environ. Microbiol. 43:997-1000.
23. Palumbo, S. A., D. A. Morgan, and R. L. Buchanan. 1985. The influence of temperature, NaCl, and pH on the growth of Aeromonas hydrophila. J. Food Sci. 50:1417-1421.
24. Eddy, B. P. 1960. Cephal